Bike Maps with CartoDB
We’re going to map data from Pronto Cycle Share, a Seattle bike share program, with a tool called CartoDB. You don’t need to ride a bike to do this tutorial. Oh, and if you’ve never made a map or web map, that’s cool too.
We aren’t going to show you how to make one type of map in this tutorial. Instead, we’ll show you how to get access to CartoDB, connect to data and explain what the provided data means. At that point, the rest is up to you and your fellow mappers to define what types of maps you want to make. Share and collaborate! Email maptimesea@gmail.com with a link to your map, code snippet or screenshot and we’ll add it to the examples on this page.
Pronto Cycle Share
Why Pronto data? Well, the program is local, the data is spatial, generated by real bikers and freely available. Plus we think Seattle needs more transportation options. Getting people to explore how things are is a great way to raise awareness and drive (bike?) toward a better future.
CartoDB
The motto at CartoDB is “Maps for the Web, made easy”. Making maps is not easy, but it doesn’t have to be hard either. CartoDB supplies tools to connect and style data for maps in a web browser. Here at MaptimeSEA, we’ve found this to be a very fast way to explore and visualize spatial data on the web. Plus, CartoDB is built on and contributes to open source projects. And it’s worth mentioning that they have a free tier.
Objectives
- Support fellow mappers
- Have a good time
- Grok the data
- Setup CartoDB
- Connect to data
- Explore and visualize
- Show and tell
Grok Data
Before we get started, we need to understand the data at our disposal. This will help us frame questions. We could find that the way the data, as it exists in its current states, limits the maps we can make. That’s okay. Feel free to think about what the data should look like. How might you get from A to B? There are no bad questions. If you get stuck, share your idea and others might have an angle. If you are doing this tutorial along get in touch with @MaptimeSEA.
Origin
The data used for this tutorial comes from the Pronto Cycle Share Current Station Data feed. This data feed presents real time attributes about each Pronto Station. We queried this data every minute for a few days and then processed those json files into a comma separated file. If you want to know more about how we did that, check out MaptimeSEA/prontodata. Also, checkout the flattened files in data_processed.
Fields
The station attributes present in this data feed are documented here. In the compiled dataset, we have a record for each station, with each attribute, every minute.
Sample questions
- Average Number of Bikes Available
- Change in time in available bikes
- Elevation
- How current is the data?
- Can we draw paths (as the crow flies) for bike paths
- Other?
Setup
If you don’t already have an account, visit the signup page and create one. Once you’re in, you will land on a page that looks something like this:
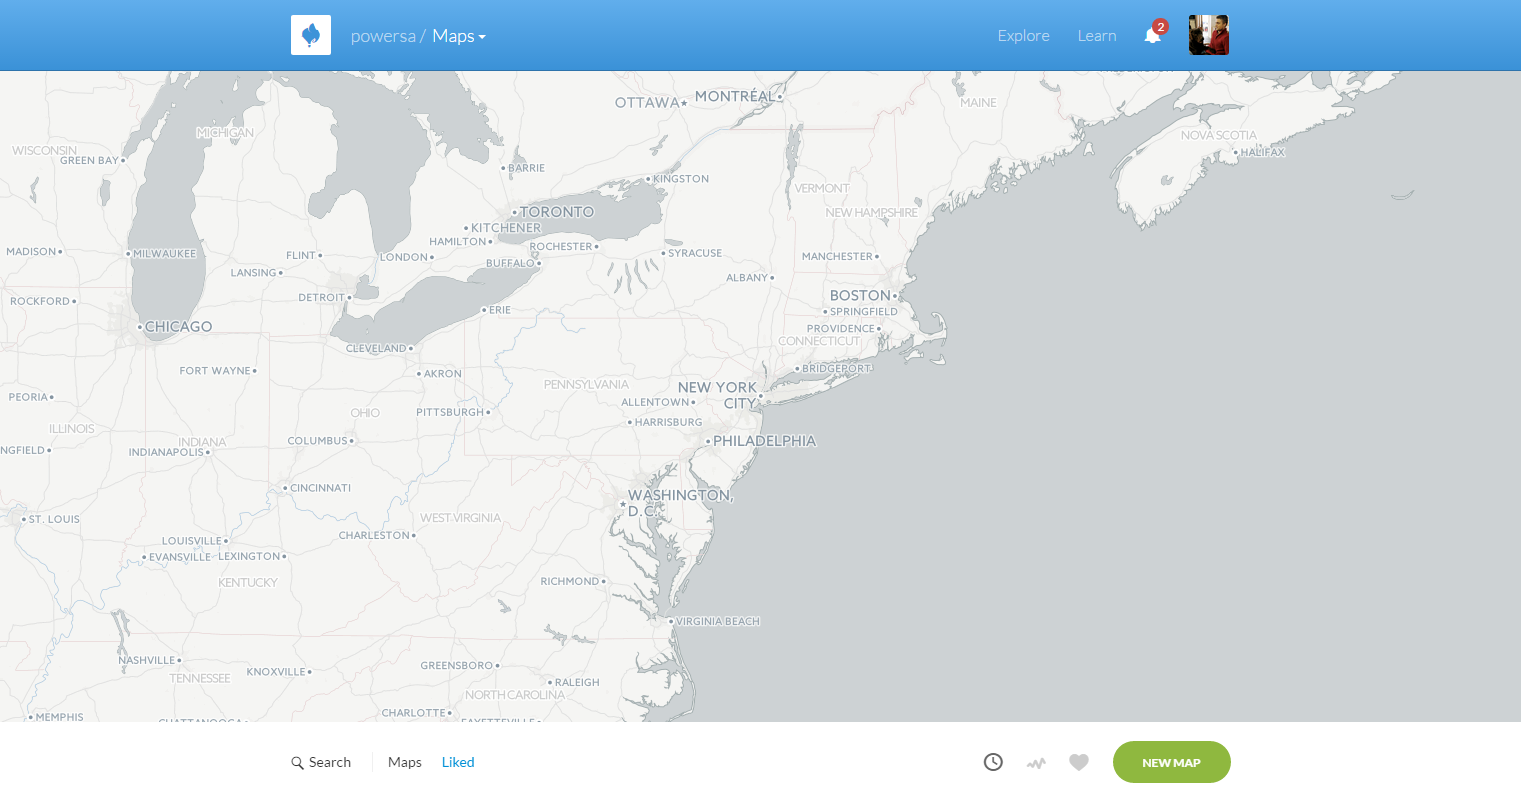
You’re ready to rock!
Connect
Okay, so now we need some data. Navigate to Your datasets
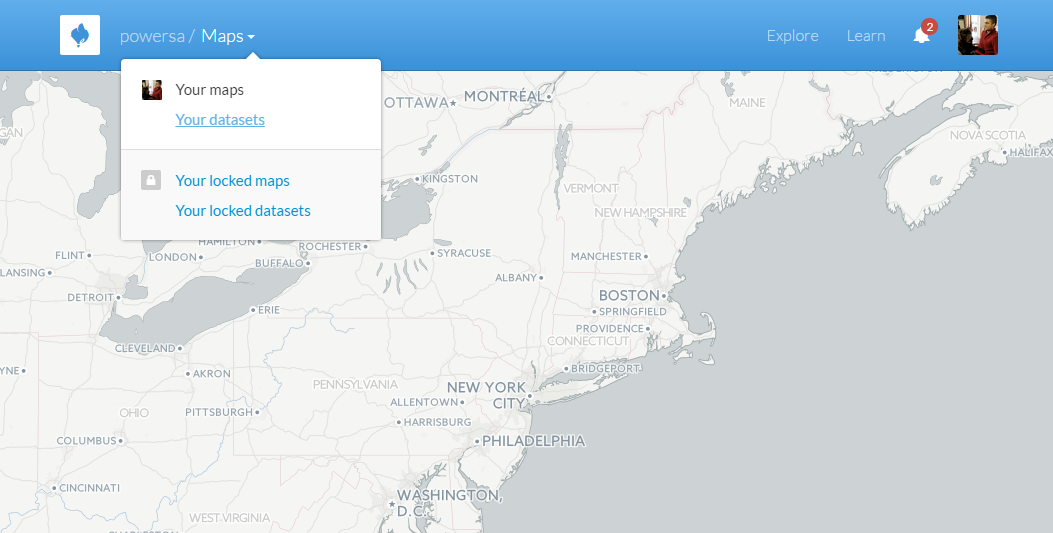
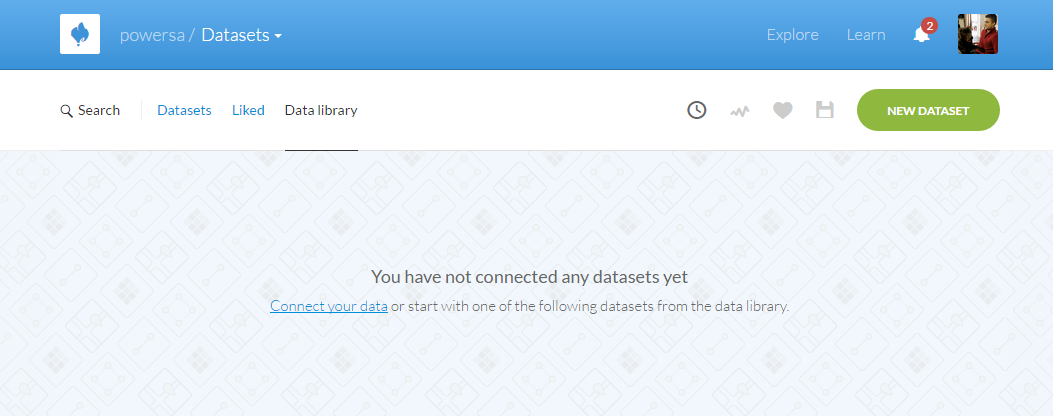
You are now in the dataset view. We need data. Click NEW DATASET to load data.
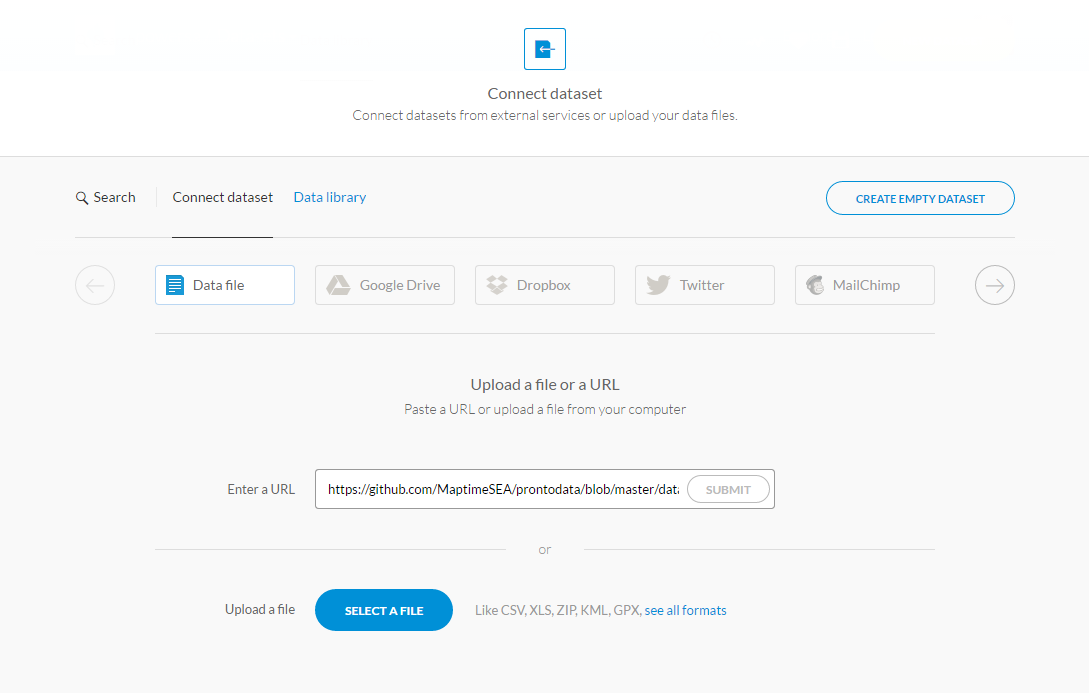
CartoDB gives you lots of ways to connect to data. Today, we’ll connect via URL. Drop this link to station_data_1min_interval.csv into the Enter a URL field:
BOOM! You’ve got data yes you do. This is what it might look like:
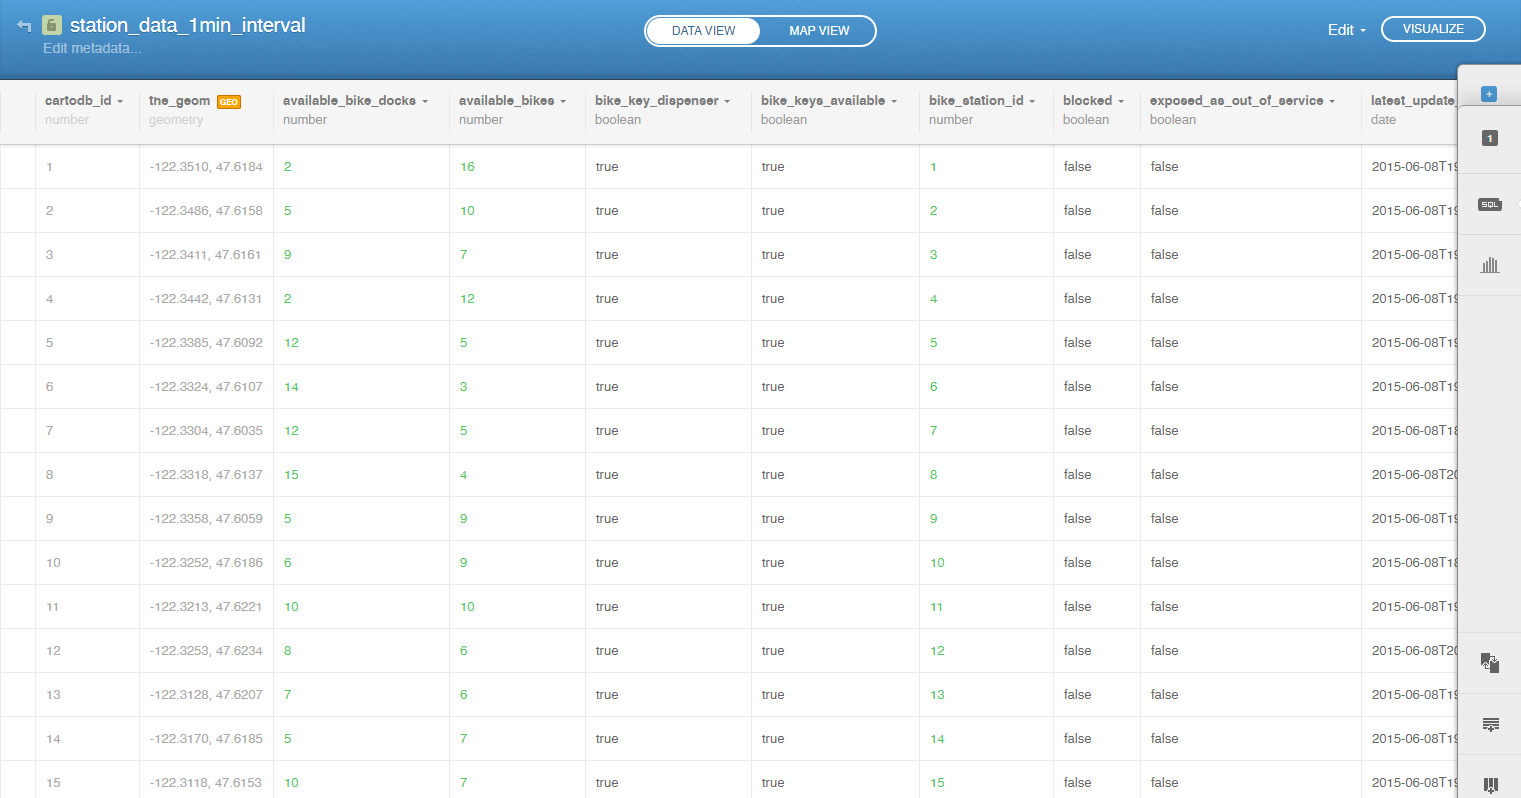
Off to the Races
We’ve got data. Let’s go. PS - link to more data if it’ll help you make maps.
Our Work
Let’s use this space to document some of the maps we made. Send a static copy of your map with a description of what it shows and we’ll plug it in to this section.