Mapping with D3.js - v2.0
Intro
D3 is a powerful data visualization library written by Mike Bostock that helps connect data to graphical elements, and then apply data-driven transformations to those elements. The basic idea is that when the data is bound to graphics, you can produce more portable graphics and much more dynamic visualization with less effort.
So why use D3 for maps? Maps are fundamentally graphical objects based on data, and D3 has built in support for map projections and transformations. D3 is actually the backend renderer for SVG images in the OpenStreetMap editor iD, so that’s a pretty good endorsement for D3 mapping!
So why not use another library like Leaflet.js? The short answer is that D3 will be advantageous when you really want to customize interactivity and dynamic visualization. The tradeoff is in ease-of-creation: D3 will take more time to customize the map to what you want. That said, there’s really no reason you can’t use both D3 and Leaflet together! Here is a great tutorial example using D3 to create dynamic overlays on a Leaflet map.
What can I create with D3?
Check out these links for some examples of D3 visualizations:
The full gallery of D3 visualizations
Geographic Projections: animated, and draggable
The famous “Wealth of Nations” Viz
Global Obesity Data Viz & Cartogram (by Ryan)
D3/Leaflet Earthquake Visualizations (by Ryan)
D3 - Data Driven Documents
D3 stands for Data Driven Documents. We will unpack this title in three parts.
Data
D3 has straightforward functions to grab data from a variety of sources including XMLHttpRequests, text files, JSON blobs, HTML document fragments, XML document fragments, comma-separated values (CSV) files, and tab-separated values (TSV) files. Part of the tremendous power of D3 is that it can take data from a variety of sources, merge different data sources, and then join data elements to the visual elements that represent the data.
Driven
Driven is actually one of the defining characteristics of D3: the graphical elements are defined by the data. In other words, each circle, line, or polygon also contains the data they are defined by. A desktop GIS software works in the same way while you’re working on your map, but when you export the map, the vector-based features lose the data that defines them. If you export a raster image those attributes are completely converted to color values and the data is detached completely.
That type of thing doesn’t happen in D3. Not only does your data define the elements in your graphic, the data is also bound (joined) to the elements in your document. A circle isn’t just a circle element with an x,y and radius, it’s also the data that originated the element in the first place. This characteristic of D3 allows data to drive your visualization, not only upon creation, but throughout its life cycle.
Documents
At its core, D3 takes your information and transforms it into a visual output. That output is usually a Scalable Vector Graphic, or SVG that lives in an HTML document. SVG is a file format that encodes vector data for use in a wide array of applications. SVGs are used all over the place to display all kinds of data. If you’ve ever exported a map from desktop GIS and styled it in a graphics program, chances are your data was stored as SVG at some stage of the process.
SVGs are human readable, which works well for us because we aren’t computers. This is an SVG in code:
<svg width="400" height="120">
  <circle cx="40" cy="60" r="10"></circle>
  <circle cx="80" cy="60" r="10"></circle>
  <circle cx="120" cy="60" r="10"></circle>
</svg>
And this is the rendered version of that code:

SVG’s work similarly to html pages, where tags represent objects that can have objects nested within them: each circle is an element nested within the SVG. Each circle contains some coordinates of the object’s center (cx, cy), and radius (r), so the SVG is just a set of instructions defining the geometry of each object, where to put each object, and how to style the objects in the SVG coordinate space.
It’s also worth noting that D3 has the ability to select, write, and edit any element on the HTML DOM, and any of the SVG shape elements like rectangles and lines. Later we’ll learn to use D3 to create <path> elements to draw complex country boundaries on our map.
Tutorial Time!
What do I need for this tutorial?
To successfully follow this tutorial you need a text editor (such as Notepad++, Brackets, or Sublime Text). Go ahead and use your personal favorite, or if you don’t have one installed, download Brackets, it’s free.
Also, to complete this tutorial without running a local web server (not what we’re here to learn), you’ll need to open your web map in Safari, Firefox, or Chrome. Download Chrome.
What map are we making?
With any luck, today we will produce this map, which displays a GeoJSON feed of daily earthquakes around the world. We’ll do this in steps:
-
Start with a simple webpage containing the SVG we saw above
-
Learn to select and manipulate existing SVG objects with D3
Change attributes and styles to control sizes and colors:

Bind data to change positions:

-
Learn to create SVG elements from scratch to build a scatterplot

-
Read GeoJSON data and scatterplot the data (no geo-projection)

-
Geographically project the GeoJSON data

-
Add country boundaries to the map

By the time we finish this tutorial, we will have built our first (or nth) D3 web map! This will not be the prettiest map you’ve ever made, but hopefully once you’ve made it, you will have a launching pad to make an even better D3 map in the future.
Tips
- The learning curve can be pretty steep. Stay positive. Ask lots of questions.
- Start simple, add complexity piece by piece
- Refer to documentation / tutorials
- Cannibalize code wherever/whenever you can. D3 has great examples and most the code is freely accessible.
- In this tutorial, SOLUTIONS ARE PROVIDED AT THE END OF EVERY STEP under headings like this: ### nth Challenge Solution Here ### Or clone this git repo to get all of the starter/solution files ahead of time
STEP 1: Create a simple web page to hold our SVG graphic
I’ve included the quick-and-dirty overview of how simple web pages work, along with some boilerplate HTML we can use to get started. If you need more of a refresher on how to make a simple web page, have a look a our web map tutorial.
Like nouns, adjectives, and verbs, the web (in its simplest form) is made of HTML, CSS, and Javascript.
- The HTML describes what’s IN your webpage: the nouns.
- The CSS describes what everything LOOKS like: the adjectives.
- The JavaScript describes what your webpage DOES: the verbs.
D3 is like a word processor that you use to write complete sentences: it helps you BUILD your webpage by constructing HTML, SVG, CSS, and even JavaScript elements dynamically from your data.

Copy this HTML code to your text editor, and SAVE your file as hello-d3.html to get started
<!doctype html>
<html lang="en">
<!-- Save me as: hello-d3.html -->

<head>
  <meta charset="utf-8">

  <!--   using D3 version 4-->
  <script src="https://d3js.org/d3.v4.min.js"></script>

    <!--  could add CSS inside the <style> tags -->
    <style>

    </style>

</head>

<body>
  <svg width="400" height="120">
    <circle cx="40" cy="60" r="10"></circle>
    <circle cx="80" cy="60" r="10"></circle>
    <circle cx="120" cy="60" r="10"></circle>
  </svg>

  <script>
    /* Your JavaScript Here */

  </script>
</body>
</html>
Notice that we have already included the D3.js script (version 4) at the top of the page inside the <head> tag.
  <!--   using version 4-->
  <script src="https://d3js.org/d3.v4.min.js"></script>
I have also included the SVG we discussed above inside the <body> tag, which we’ll learn to manipulate with D3. It should look like this.
  <svg width="400" height="120">
    <circle cx="40" cy="60" r="10"></circle>
    <circle cx="80" cy="60" r="10"></circle>
    <circle cx="120" cy="60" r="10"></circle>
  </svg>
Open hello-d3.html in a web browser. You should see something like this:
In hello-d3.html, find the <body> tag, then find the <script> tag inside the <body>. All of our code will go there.
From here on out, most of what we’ll be doing is writing JavaScript to select and add things to the web page.
    <script>
    	/* Your JavaScript Here */
    </script>
STEP 2: Learn to select SVG objects with D3
Your first D3 Selection
D3 has really easy shorthand for selecting objects in webpages. First, we’ll ask D3 to select the <body> tag, and then select the <svg> inside the body.
Writing your code between the <script> tags, add the following code.
  var body = d3.select("body"); // select the html element with <body>

  var svg = body.select("svg"); // select the <svg> that lies within the <body>
You just did your first D3 Selection! Notice that we only selected ONE object with .select(). To select multiple objects, try .selectAll() as as shown below:
Add this line of code to your hello-d3.html to select ALL of the circle objects in the SVG
var circle = svg.selectAll("circle");
Not very exciting, but this will provide us with a little intro to how to debug your scripts in a web browser using the browser’s Developer Tools.
Find the Developer Tools for debugging your code by doing the following:
To see the contents of the variables “body”, “svg”, or “circle”
- go back to your web browser showing hello-d3.html
- right click on one of the circles
- select “Inspect” or “Inspect Element”, which shows you the source code for that element in the page
- find the “Console” section or tab
- type “circle” into the console to access your stored “circle” variable (a D3 “selection”, which contains an array), which should reveal something like this:
> dt {_groups: Array[1], _parents: Array[1]}
You can expand the dropdown arrows and see the contents of the circle object. This is a handy way to get behind the scenes of your JavaScript code. You can also access the console directly from inside your code by adding things like:
console.log("Here's my svg at step 1:");
console.log(svg);
The console will also show you errors in your code, but I’m sure you’ll never have any of those…
1st Challenge, 15 minutes: Change the Color and Size of the SVG elements
Head over to this awesome tutorial, and read the first section entitled: Selecting Elements.
In the tutorial, find the code that changes the color and size of circles, then modify the script we started above to give your circles the following properties
- radius: 20
- fill: “darkred”
NEED A HINT? Check out the lines: circle.style("fill","steelblue"); and circle.attr("r",30);. Paste those two lines into your script, then change the "steelblue" and 30 to "darkred" and 20. If your web page is blank, check the Console for errors (Right click in the page, and “View Source”, then find the “Console” tab).
Your result should look something like this:
1st Challenge Solution Here
Side note: the JavaScript to accomplish the same task without D3 and using the HTML Document Object Model API would look like the code below. Much more tedious!
    var circles = document.getElementsByTagName("circle");
    for (var i = 0; i < circles.length; i++) {
      var circle = circles.item(i);
      circle.style.setProperty("fill", "darkred", null);
      circle.setAttribute("r", 20, null);
    }
Next Step: Binding Data to Circle Elements:
Conceptually, what we want to do next is to take our selection of circles (left in the image below), and BIND the circles to a data array like this [5, 15, 30] (right in the image below)
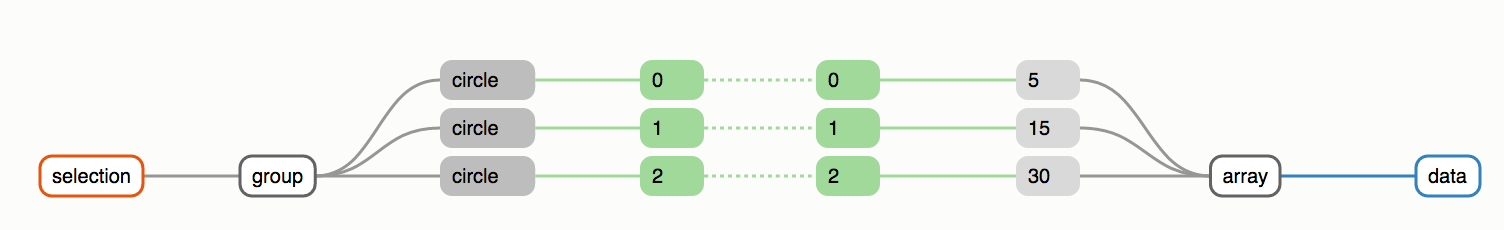
After we’ve bound the data, we can retrieve the data to set attributes on the circles, as we did before. The Binding Data section of the same tutorial, will show you how to do that!
2nd Challenge, 10 minutes: Find the code in the Binding Data section of the tutorial that will help you bind the data array below to the cy attribute on each of your circles.
var myData = [ 20, 60, 100 ];
NEED A HINT? You can start by just copying the first few lines of code in the Binding Data section of the tutorial into your script
	circle.data([32, 57, 112]);
	circle.attr("cx", function(d) {
  				return d;
			   });
Then replace the [32, 57, 112] with myData, and change the "cx" to "cy".
Your result should look something like this:
If you get wacky results, be sure you changed the cy attribute and not the cx attribute as they do in the tutorial!
2nd Challenge Solution Here
Advanced Challenge, if you have extra time: Add Transition Effects
Check out this simple example of a transition, or this thorough explanation of transitions and see if you can transition from one state to another. You probably want to have your code triggered by a button so you can see the transition happen. To add a button, add the following snippet to your script (not the html), then add all of the code we’ve written (plus your transitioning code) inside the function myFunction().
    // use d3 to add a new button in the body
    d3.select("body")
      .append("button")
      .on("click", myFunction) // link the myFunction function to the button click
      .text("Run My Function"); // add some text to the button

    function myFunction() {
      // add your transitioning code here
    }
Further Reading on Transitions: Mike’s tutorial on Transitions, Chained Transitions, Crazy transform Transitions.
Advanced Challenge Solution Here
See the Solution Live Here
STEP 3: Creating SVG Elements From Scratch
We don’t need no stinking <svg>’s in our <body>!! D3 can create them on the fly.
Copy the code to below to your text editor, and SAVE to a file called myScatterPlot.html.
Notice that there’s no SVG in the <body>: just the script, which uses D3 to create the SVG from scratch!
<!doctype html>
<html lang="en">
<!-- Save me as: myScatterPlot.html -->

<head>
  <meta charset="utf-8">

  <!--   using D3 version 4-->
  <script src="https://d3js.org/d3.v4.min.js"></script>

    <!--  could add CSS inside the <style> tags -->
    <style>

    </style>

</head>

<body>
  <script>
    var width = 700,
        height = 500;

    var svg = d3.select("body")
                .append("svg"); // NOW svg looks like this in the document:
                           // <body>
                           //    <svg></svg>
                           // </body>
    svg.attr("width", width)
        .attr("height", height) // NOW svg looks like this in the document:
                           // <body>
                           //    <svg width="700" height="500"></svg>
                           // </body>
        .style("border","3px solid black")
        .style("background-color","lightblue");
                           // NOW svg looks like this in the document:
                           // <body>
                           //   <svg width="700" height="500" style="border: 3px solid black; background-color: lightblue;">
                           // </body>

    // here's your data to plot!
    var myData = [ 20, 60, 100, 300 ];

    /* add your code to create circles here */

  </script>
</body>
</html>
Your job (in the challenge below) will be to finish the rest of the script to add some circles and make a scatterplot.
Have a look at the JavaScript code above: This line selects the <body> tag and appends an <svg> to it.
	var svg = d3.select("body")
	            .append("svg");
When we append() to the <body> element, D3 just adds a new <svg> just below the script that we’re actually writing. Yeah, you heard that right: we’re writing code to edit the document that we’re working on….#MINDBLOWN.
The next lines just adds attributes and styles to the SVG in the same way we were doing to the circles in the tutorial. Here’s the full documentation for styling SVG elements for reference.
You may notice that I have started chaining methods together. I can do that because the .attr() and .style() methods assign an attribute or style first, then they return a reference to the svg that they just modified. You’ll see method chaining a lot in D3.
3rd Challenge, 15 minutes: Create Circles from scratch using data!
Start with the same tutorial, but now move onto: Creating Elements. When you’ve finished reading through that section, you should be able to figure out how to plot the data that’s defined at the end of your script.
    // here's your data to plot!
    var myData = [ 20, 60, 100, 300 ];
Further Reading on Selections and Data Binding: How Selections Work, Thinking With Joins, and The Original Three Little Circles Tutorial
Starting with the myScatterPlot.html file you created above, add some circles to create your first scatterplot.
(Hint, find the second to last (or last) code block in the Creating Elements section of the tutorial, and then figure out how to modify the function(d) { return d; } section of the code to return the data values in the proper format)
- cx: myData
- cy: myData / 2
- radius (“r”): square root of myData (use JavaScript’s Math.sqrt() function)
You can add the following styles if you have time, or add your own styles.
- fill: “rgb(255, 255, 0)”
- stroke: “black”
- stroke-width: 1
- opacity: 0.5
When you’re done, pat yourself on the back for having made a scatterplot from scratch!
You should see something like this: (If you didn’t add styles, your circles will just be black, which is totally fine)
3rd Challenge Solution Here
STEP 4: Read GeoJSON data and scatterplot that data (no geo-projection)
OK, enough of this plotting boring arrays of meaningless data. Let’s plot something EARTH SHATTERING!!! How about earthquakes? (Oh!! See what I did there??).
The United States Geological Survey (USGS) publishes GeoJSON feeds of recent earthquakes on their website, so we can get longitude, latitude, depth, magnitude, etc, of just about any earthquake ever recorded by human intstruments. The data format will be GeoJSON, which will be a bit more complicated to reference, but is still just an array of data features.
Where before we had var myData = [ 20, 60, 100 ];, now we’ll have something like:
var myData = [ {/* object with data */ }, {/* object with data */ }, {/* object with data */ } ];
Each block { } will be parsed into a JavaScript object, which could hold arrays of sub-data. Have a look here for the basic formats and JSON data structures if you need help.
The code below shows an abridged version of the USGS data format with three earthquake “features”. I have deleted a lot of attributes and reformatted the tabs so you can see where the coordinate data “lives” in the GeoJSON data structure. To see the whole feed of all global earthquakes in the past day, click here, or click here a nicely formatted example of 3 earthquakes
{
    "type": "FeatureCollection",
    "metadata": {
        "count": 3
    },
    "features": [
        {
            "type": "Feature",
            "properties": {
                "mag": 6.6,
                "place": "78km NNE of Ust'-Kamchatsk Staryy, Russia"
            },
            "geometry": {
                "type": "Point",
                "coordinates": [
                    162.734,
                    56.9205,
                    22.83
                ]
            }
        },
        {
            "type": "Feature",
            "properties": {
                "mag": 3.61,
                "place": "2km ESE of Loma Linda, CA"
            },
            "geometry": {
                "type": "Point",
                "coordinates": [
                    -117.2386667,
                    34.0388333,
                    17.64
                ]
            }
        },
        {
            "type": "Feature",
            "properties": {
                "mag": 6.3,
                "place": "32km NW of Kandrian, Papua New Guinea"
            },
            "geometry": {
                "type": "Point",
                "coordinates": [
                    149.353,
                    -5.999,
                    31.07
                ]
            }
        }
    ],
    "bbox": [
        -117.2386667,
        -5.999,
        17.64,
        162.734,
        56.9205,
        31.07
    ]
}
So, we just need to know how to pull the data out of this “blob” and attach it to our circles. Here’s how: if a webserver can feed me the data above as a string (a blob of text), D3 can parse that and refer to objects inside the JSON like this:
    var todaysQuakesFeed =
        "https://earthquake.usgs.gov/earthquakes/feed/v1.0/summary/all_day.geojson";

    // send a JSON request to the earthquake feed,
    d3.json(todaysQuakesFeed, function(parsedJSON){ // <-- result of the parsing is in the variable parsedJSON

      console.log("Number of quakes = " + parsedJSON.metadata.count);

      console.log(parsedJSON.features); // log the features array to the console

      console.log(parsedJSON.features[0].properties); // log the properties for the first feature to the console

      console.log(parsedJSON.features[1].geometry); // log the geometry for the second feature to the console
    });
The first console.log("Number of quakes = " + parsedJSON.metadata.count); refers to a single variable, which it prints to the Developer Tools console. The next statement console.log(parsedJSON.features); prints the whole array of features to the console. In the 3rd and 4th console.log() statements print out properties on an individual feature by index (0..n-1).
4th Challenge, 15 minutes: Extract that data from the GeoJSON!!!
Copy and paste the html below to a file called myEarthquakeMap.html.
This script does the following, some of which should look familiar
- The first few lines create an SVG in the body with some size and style attributes
- The d3.json(…) send the JSON request from the URL to get the GeoJSON data
- The lines inside the
function(parsedJSON) { }block creates some circles on the SVG with their cx, cy = [0,0]
Your task will be to modify the two .attr(“cx”, …) and .attr(“cy”, …) to assign the longitude (x) and latitude (y) to the “cx” and “cy” variables.
I know, I know, lat/long’s can be negative, and lat/long’s aren’t the same thing as SVG pixels, but we’ll get to that very soon.
Hint: Open up the Developer Tools Console and look at the structure of the data that gets printed to the console.
Then try to print data you want to the console using console.log(). You should try to print from inside function(d) { return 0; } (but before the return statement). Also, remember to make use of the actual USGS documentation to understand the GeoJSON data and properties!
<!doctype html>
<html lang="en">
<!-- Save me as: myEarthquakeMap.html -->

<head>
  <meta charset="utf-8">

  <!--   using D3 version 4-->
  <script src="https://d3js.org/d3.v4.min.js"></script>
  <script src="https://d3js.org/topojson.v2.min.js"></script>

  <!--  could add CSS inside the <style> tags -->
  <style>

  </style>

</head>

<body>
  <script>
    var width = 700,
        height = 500;

    // set up the SVG
    var svg = d3.select("body")
                .append("svg");
    svg.attr("width", width)
        .attr("height", height)
        .style("border","3px solid black")
        .style("background-color","lightblue");

    var todaysQuakesFeed =
        "https://earthquake.usgs.gov/earthquakes/feed/v1.0/summary/all_day.geojson";

    // send a JSON request to the earthquake feed,
    d3.json(todaysQuakesFeed, function(parsedJSON){ //-- result of the parsing is in parsedJSON

      // examples of referencing data within the parsedJSON
      console.log(parsedJSON.features); // log the whole features array to the console

      console.log("First Feature.geometry")
      console.log(parsedJSON.features[0].geometry); // log the geometry for the first feature to the console

      svg.selectAll("circle")
          .data(parsedJSON.features) //-- notice that we refer to .features: an array just like before!
        .enter().append("circle")
          .attr("cx", function(d) { //-- this 'd' refers to A FEATURE in the array
                  // MODIFY THE NEXT LINE TO RETURN THE EARTHQUAKE LONGITUDE
                  // from the JSON feature (return d.something.something[number];)
                  return 0;
                })
          .attr("cy", function(d) { //-- this 'd' refers to A FEATURE in the array
	          // HINT: if you get stuck, un-comment the next two lines, reload the page, and see the console
                  // console.log("d is: ");
                  // console.log(d);

                  // MODIFY THE NEXT LINE TO RETURN THE EARTHQUAKE LATITUDE
                  // from the JSON feature (return d.something.something[number];)
                  return 0;
                })
          .attr("r", 10 ) // try adding a function here that returns the magnitude
          .style("fill", "rgb(255, 255, 0)")
          .style("stroke", "black")
          .style("stroke-width", 1)
          .style("opacity", 0.5);
    });

  </script>
</body>
</html>
When you’re done, you should just see some earthquakes in your SVG. Their locations will be different depending on today’s earthquakes!
4th Challenge Solution Here
Advanced Challenge: Add a Tooltip to show Earthquake Magnitude
Check out this simple tooltip example and add a tooltip showing the earthquake’s magnitude (feature.properties.mag) when the user mouses-over an earthquake.
4th Challenge Advanced Solution Here
STEP 5: Define your projection and project the data!
When you define a projection, you tell D3 how to transform your data from spherical to Cartesian coordinates. Take a look at the projection docs to get a sense of how you can project your data with D3.
We can choose from all kinds of projections: Azimuthal, Cylindrical, Conic, Composite. Clicking on the images in the documentation links you to bl.ocks.org examples that show the projection scales to get you started.
Generally we set up the projection ahead of time, then USE it to project all of the data. Here’s an example of an equirectangular projection:
    var projection = d3.geoEquirectangular() // in D3 version 3, this will be d3.geo.equirectangular() -- notice the difference!
        .scale(height / Math.PI)
        .translate([width / 2, height / 2]);
The .scale() and .translate() are basically like zooming and panning around in x,y space. Generally you can look at an existing example to figure out what the scale should be, and then try your own scaling and translation from there.
Notice that the d3.projection object is also a function, meaning, you can pass it an arary of [longitude,latitude] like this: projection([longitude,latitude]) and it will return an [x,y] array.
So: Longitude, latitude go in; x , y come out
For our parsed JSON example, we can project like this:
      var x = projection( d.geometry.coordinates )[0];
      var y = projection( d.geometry.coordinates )[1];
What the hell is that???? Let’s break it down:
- We call projection( [longitude, latitude] ) on our earthquake coordinate array (as it turns out, D3 will just ignore the 3rd “depth” coordinate)
- projection() returns an [x,y] array, and we refer to the first element of the array with [0] to get x, and the second element [1] to get y
We could rewrite it like this to be more explicit
	var lat_long = d.geometry.coordinates; // get the lat long array
	var x_y = projection(lat_long); // project to an [x,y] array
	var x = x_y[0]; // get x from the array
	var y = x_y[1]; // get y from the array
5th Challenge, 15 minutes: Add the projection code shown below to our un-projected scatterplot example! Define the projection just below where you defined the width and height:
    var width = 700,
        height = 500;

    // define the map projection
    var projection = d3.geoEquirectangular() // in D3 version 3 this will be:
        .scale(height / Math.PI)
        .translate([width / 2, height / 2]);
And then modify the function where we assign the “cx” and “cy” attributes like this:
          .attr("cx", function(d) { //-- this 'd' refers to A FEATURE in the array
                    var x = projection( d.geometry.coordinates ) [0];
                    return x;
                })
          .attr("cy", function(d) { //-- this 'd' refers to A FEATURE in the array
                    var y = projection( d.geometry.coordinates ) [1];
                    return y;
                })
We can add a quick and dirty scaling of the circle sizes to earthquake magnitudes like this:
.attr("r", function(d){ return d.properties.mag > 0 ? 1.5 * d.properties.mag : 0; } )
To get really fancy, we can ANIMATE the earthquakes by adding some transition effects just above where we set the radius
          .transition()
          .duration(500)
          .delay(function(d,i){ return i * 100; })
          .ease(d3.easeElastic)
          .attr("r", function(d){ return d.properties.mag > 0 ? 1.5 * d.properties.mag : 0; } )
This code requests a transition to occur for each earthquake, in sequence. The .delay(function(d,i){ return i*100; }) line really does most of the work here, telling D3 to wait a few milliseconds between each transition (i is the index in the parsedJSON.features) array. The .duration() controls how fast the transition happens. The .ease() controls the rate of change of the transition, which in this case makes the earthquake pop a little beyond the radius, then get smaller.
5th Challenge Solution Here
STEP 6: Add some country boundaries…FINALLY, something that looks like a MAP!!!
When you complete this step, you will have a map to “back up” your earthquake data. In the interests of time, I’ll just give you some pre-written code and then explain how it works.
6th Challenge, 15 minutes or less: Copy and Paste the following block of code JUST ABOVE THE closing </script> tag near the bottom of your html file
Refresh your map. Then sit back, bask in the glory, and then we’ll talk about how it all works
    function drawCountryBoundaries() {
      // define the path generator (this should really be at the top)
      var path = d3.geoPath()
          .projection(projection);

      // send a JSON request to get the world boundaries
      var worldBoundariesURL = "https://ryshackleton.github.io/d3_maptime/data/world-topo-min.json";
      d3.json(worldBoundariesURL, function(world) {

        // create a group <g> element at the front of the SVG
        // (this ensures that our country boundaries will be below everything else)
        var g = d3.select("svg") // select the svg
                  .insert("g",":first-child") // insert a group element at the top of svg
                  .attr("id","country-boundaries"); // give the group an id for reference

        // Draw the world map boundaries on the <g> element
         g.selectAll("path")
              .data(topojson.feature(world,world.objects.countries).features)
            .enter().append("path")
              .attr("d", path ) // ask d3.geoPath() to define the SVG drawing path
              .style("fill","#e5e5e5")
              .style("stroke","#333")
              .style("stroke-linejoin","round");
      });
    }
    drawCountryBoundaries();
6th Challenge Solution Here
6th Challenge Live Solution
Map should look vaguely like this, although the earthquake locations will be different than in this image
Projection for lines
When D3 renders lines as SVG, it has to translate a vector format containing vertices ([longitude,latitude]) and line segments in (GeoJSON), to SVG path instructions in X,Y space, which are the the rough equivalent of “move to x,y, draw a line to x1,y1, move horizontally by 10 pixels, draw a horizontal line to….”. So it has to project all of the coordinates, then turn them into those wacky instructions. I’m SOOO glad someone else wrote that code. This functionality is called a path generator. The path generator line almost always looks just like this, and it always need to be told what projection to use.
	var path = d3.geoPath() // in D3 version 3, it will look like d3.geo.path() - notice the difference!!!!
                     .projection(projection); // SET the projection we defined above to the path generator
So, the path generator is kind of like projection for lines: line segments with [long,lat] coordinates goes in, projected path instructions in x,y space comes out
The next few lines do the same thing we did before: parse data from a GeoJSON-like format called TopoJSON. The TopoJSON format is similar to GeoJSON, but is specifically designed to reduce file size. You can grab the data here.
      // send a JSON request to get the world boundaries
      var worldBoundariesURL = "https://ryshackleton.github.io/d3_maptime/data/world-topo-min.json";
      d3.json(worldBoundariesURL, function(world) {
      });
For future reference: Mike Bostock has a great tutorial on how to process your own TopoJSON files from shape files and other datasets. Most D3 examples you will see now use TopoJSON, but D3 can still read GeoJSON just fine.
The next lines just make sure that the country boundaries are BELOW the earthquakes by inserting a <g>, or grouping element at top of the SVG instructions that we can put countries into. SVG renders each graphical element in top-down order, so for the country boundaries get rendered FIRST, then they need to be read by the SVG before the earthquakes (<svg> <g name="countries-lay-me-out-first"/> <g name="earthquakes-lay-me-out-second"/> </svg>).
        // create a group <g> element at the front of the SVG
        // (this ensures that our country boundaries will be below everything else)
        var g = d3.select("svg") // select the svg
                  .insert("g",":first-child") // insert a group element at the top of svg
                  .attr("id","country-boundaries"); // give the group an id for reference
Now we select the grouping node <g> we just created, and append drawing paths to the group. The code looks similar to the circle drawing code, except that we append a “path” instead of a circle, and then instead of setting “cx” and “cy”, we set an attribute on the <path> called “d”. The <d> element contains that wacky set of line-drawing instructions: “move to x,y, draw a line to x1,y1, …” that gets generated by D3’s path generator. So, the .attr("d", path ) line lets us have d3 generate the path for each feature geometry (path( d ) is called for every country feature).
        // Draw the world map boundaries on the <g> element
         g.selectAll("path")
              .data(topojson.feature(world,world.objects.countries).features)
            .enter().append("path")
              .attr("d", path ) // ask d3.geoPath() to define the SVG drawing path
              .style("fill","#e5e5e5")
              .style("stroke","#333")
              .style("stroke-linejoin","round");
      });
For a much better explanation of paths and path generators, see this book section and the Command Line Cartography Tutorial. This is a great way to launch into Choropleth Maps.
Congratulations! You built a web map in D3.js! Thanks for coming.
Further Reading:
Here are some D3 References that I have found very useful:
Free Book
Interactive Data Visualization for the Web - probably the most thorough place to start, and has some GREAT chapters on D3 at the end
Other Cool D3 Maptimes
SVG
Bl.ocks.org:
Legends:
Reusable Custom D3 Charts:
Towards Reusable Charts: a must read if you really want to use D3 extensively
Simple example of a Reusable Chart
Cartograms:
Excellent US Cartogram example
Fin.
Hope that was helpful! Please fill out our survey when you are done even if you couldn’t attend the meeting. We want to make sure the MaptimeSEA tutorials are teaching what you want to learn. bit.ly/maptimesea_survey